The Impact of a Physical Education Teacher's Initiative on Grade 4 Students’ Motivation
Previously published in volume 85, Issue 1
Abstract
Several studies associate physical activities with a reduction in the problems unique to vulnerable students. Thus, initiatives to promote motivation for physical activity appear essential. The objective of this research was to determine if participation in a physical education (PE) teachers’ initiative made it possible to increase unmotivated students’ expectation of success and subjective task values in PE and reduce cost (i.e., time, energy, opportunities) and sense of pressure in PE. A total of 84 elementary school students (Mage = 9.7) randomly assigned to an experimental group (N = 57) and a control group (N = 27) participated in the study. Multivariate (MANOVA) and univariate (ANOVA) analyses of variance showed that students’ sense of pressure increased significantly over time. Although no positive changes were observed, it seems important to encourage PE teachers to conduct similar initiatives, but to do so more often and earlier in the school year.
Introduction
In Quebec (Canada), students at risk of failing to meet the school’s learning and socialization goals represent a significant proportion of the school-age population (Ministère de l’Éducation, 2009). These students are considered “vulnerable” insofar as they have “a weakness in one or more areas due to the presence of certain personal, family, social or academic factors, which alone or in combination can influence a person’s learning or behaviour1” (CSPI, 2008, p. 24). School achievement, regardless of subject, may require an individual education plan, a specific teaching approach or additional help (Smeets & Roeleveld, 2016) to motivate these students. Indeed, vulnerable students experience difficulties in both basic (e.g., language, maths) and specialized (e.g., arts, music, physical education) school subjects and this can result in a lack of motivation.
Among the stakeholders in elementary schools, physical education (PE) teachers have an interesting advantage for dealing with these types of students in that physical activity can help mitigate some of their problems. For example, through physical activity practice, students can improve self-esteem, become more available for learning, adopt appropriate behaviours in the classroom, and achieve higher grades (Comité scientifique de Kino-Québec, 2011). Available data indicate, however, that only a minority of children are physically active. Indeed, only 20% of children from 5 to 11 years old meet the recommended guidelines regarding physical activity practice (ParticipACTION, 2018). As a result, fostering students’ motivation to be physically active represents a challenge for PE teachers (Bruggink, Goei, & Koot, 2013).
Expectancy-value theory
To understand why children choose to engage, persevere and expend effort in physical education, results from a meta-analysis (Chen, Chen, & Zhu, 2012) propose the expectancy-value theory (Eccles et al., 1983; Eccles & Wigfield, 2002) as a key framework. This theory holds that individuals’ motivated behaviours are determined by their expectancy-related beliefs (e.g., ability beliefs and expectation of success) in a task or domain of activity (e.g., physical education or physical activity) and by their valuation (e.g., subjective task values) of that task or domain of activity. Expectancy-related beliefs include two concepts: ability beliefs and expectation of success. The first concerns individuals’ evaluation of their capacity to perform a task or regarding a specific domain of activity; the second, their evaluation of their chances for success. Given the similarity and close relationship of these two concepts, theorists maintain they can be considered a single construct, especially in work with elementary school children (Eccles, O'Neill, & Wigfield, 2005; Eccles & Wigfield, 1995; Eccles & Wigfield, 2002; Wigfield, 1994).
Subjective task values refer to positive (e.g., attainment, intrinsic, and utility values) and negative (e.g., cost) components and are qualified as “subjective” because different individuals faced with the same task may not invest it with the same value (Wigfield, Tonks, & Klauda, 2009). Attainment value is the importance of succeeding or participating in a task along with its relevance for confirming self-aspects. Intrinsic value is interest in the task and the pleasure taken in performing it. Utility value is the usefulness of the task and its congruence with present or future goals. Cost represents what must be sacrificed to perform the task (e.g., time, energy, opportunities) as well as other negative aspects of task performance such as effort required, fear of failure, tension, pressure, anxiety, etc. (Eccles, 2005; Eccles et al., 1983; Eccles & Wigfield, 2002; Wigfield & Eccles, 1992). Although cost is an important component of subjective task values, it has received the least attention of all (Wigfield et al., 2009), which is particularly important as regards physical activity owing to the negative aspects associated with that field (e.g., fear of injury, fear of embarrassment, boredom, pressure to perform, feeling of tension, etc.) (Stuart, 2003).
According to previous research findings in the domain of sports (e.g., physical education, sports, physical activity), expectancy-beliefs and subjective task values are related to both students’ intention and actual choice to engage in physical activity (Dempsey, Kimiecik, & Horn, 1993; Gao, Lee, Solmon, & Zhang, 2009; Xiang, McBride, Guan, & Solmon, 2003; Xiang, McBride, & Bruene, 2004; Xiang, McBride, & Bruene, 2006). Therefore, to nurture students’ subjective task values regarding physical activity, PE teachers should stress the importance of the task and explain its usefulness for children in their class (Wigfield, Eccles, Schiefele, Roeser, & Davis-Kean, 2006). This is all the more important considering that children’s ability beliefs about sport tend to decline during the elementary school years (Wigfield et al., 1997).
Purpose of study
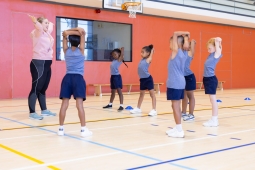
As part of their professional development, four elementary PE teachers took the initiative to plan a special event to stimulate students’ interest in physical activity by introducing new physical activities they could reinvest in PE classes. According to Pharez (2016, p. 24), “A positive experience in PE is a stepping stone toward a more active and healthy lifestyle for all students.” To be effective, therefore, teachers need to engage students in a wide range of activities and offer the opportunity to explore sports and activities of many kinds (Doolittle, 2016; Tenoschok, 2016).
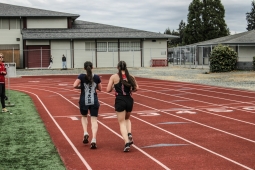
The event took place in a high school near the elementary schools. At the start of the final school term (in February), students spent half a day being introduced to four physical activities (poull-ball2, athletics, acrogym and frisbee-golf). For each activity, teachers collaborated to create a learning situation (lasting from six to eight PE classes) that would be used by teachers in PE classes until the end of the school year.
Therefore, the purpose of the present study is to evaluate if a PE teachers’ initiative to sustain students’ motivation to be physically active was effective. More precisely, the aims were to verify if participation in the event had led to: 1) an increase in students’ expectation of success and subjective task values in physical education and 2) a reduction in cost and the feeling of pressure in PE classes.
Methods
Participants and data collection
To identify students lacking motivation in their PE classes, PE teachers used an observation grid developed in collaboration with their educational consultant. Different criteria were used as indicators of lack of motivation: grades, need for special help, learning disabilities, level of participation in PE classes, physical activity practice during recess, participation in extracurricular sports, and the presence of an individual education plan. Based on these subjective observations, each of the four PE teachers were asked to select 25 fourth-graders as potential participants for the research project, for a total of 100 students randomly assigned to an experimental group (N = 603) and a control group (N = 40). The research project received ethical approval, and the school boards gave their authorization. Of these 100 students, 11 fourth-graders did not obtain their parents’ consent in writing to take part in the study, and 5 of them failed to complete a questionnaire for each measurement time. Thus, the final sample consists of a total of 84 students (experimental group = 67.9%4) aged 9 to 11 years old (Mage = 9.97, SD = .45; boys = 34.6%). Of the students as a whole, 27% had an individual education plan. Only students from the experimental group were invited to take part in the PE teachers’ initiative in February. Subsequent to that event, all students took part in the four learning situations in their PE classes. The schools were located in an urban community of Montreal and served from 600 to 950 students of low socioeconomic status5. Three of the four participating schools in the project offer 120 minutes per week of physical education. For the fourth school, physical education consisted of 90 minutes per week. Class size was in the area of 20 to 25 students. Data were collected using self-report questionnaires on three waves of assessment: prior to the initiative, after the first learning situation in PE and at the end of the school year.
Variables and Measures
Expectation of success. As suggested by Cox et Whaley (2004), the ability/expectancy- related items from the Self- and Task-Perception Questionnaire (Eccles & Wigfield, 1995) were used to assess students’ expectation of success in PE (5 items; α = .92; e.g., How well do you think you will do in your PE class this year? [1 = very poorly; 7 = very well]). For all subsequent scales, students also gave their answer on a 7-point Likert scale.
Subjective task values. As adapted by Cox et Whaley (2004), the Self- and Task-Perception Questionnaire (Eccles & Wigfield, 1995) was used to measure subjective task values: intrinsic interest value (3 items; α = .76; e.g., How much do you like doing PE? [1 = not very much; 7 = very much]); attainment value (4 item; α = .70; e.g., I feel that being good in PE is ... [1 = not at all important; 7 = very important]), and utility value (3 items; α = .62; e.g. How useful is what you learn in PE for your daily life outside school? [1 = not at all useful; 7 = very useful]). To assess cost related to investment (5 items; α = .60; e.g., My physical education classes take too much time. [1 = totally disagree; 7 = totally agree]), a questionnaire adapted from Cox et Whaley (2004), Hedhili (2016) and Raedeke (1997) was used.
Pressure. To complete the students’ questionnaire, the Pressure/tension scale from the Intrinsic Motivation Inventory (McAuley, Duncan, & Tammen, 1989) was used to measure the pressure felt by students in PE. It consisted of 5 items (5 items; α = .60; e.g., During my physical education classes, I feel very tense. [1 = totally disagree; 7 = totally agree]).
Data Analysis
Prior to the main analyses, we calculated the internal consistency (Cronbach’s alpha) of the scales at each measurement time. Values varied from .65 to .85. Owing to the small number of items for each scale, these values were all deemed acceptable (Hair, Black, Babin, Anderson, & Tatham, 2006; Pallant, 2016).
To identify differences between and within groups, multivariate (MANOVA, Wilks’ Lambda test) and univariate (ANOVA) analyses of variance were conducted. For all analyses, we considered the “Group” (experimental and control) and “Time” (time 1, 2 and 3) factors as well as the interaction of both factors (Group X Time). Effect sizes (ηp2) were calculated for univariate analyses. Consistent with Cohen (1988), values from .01 to .05 were considered a small effect, values from .06 to .13 a medium effect and values of .14 and higher a large effect.
Results
Multivariate and univariate analyses of variance were conducted in two phases: the first, for expectation of success, attainment, utility value and interest, and the second, for cost and pressure. Results from the multivariate analysis for expectation of success and the positive components of subjective tasks value (attainment, utility value and interest) were non-significant for the “Group” factor (F(4, 224) = .920, p = .45) and the “Time” factor (F(8, 448) = .762, p = .64), as well for the interaction between both factors “Group X Time” (F(8, 448) = .838, p = .57). This indicates that students’ scores from both groups were similar and it cannot be said that they varied over time. Table 1 displays descriptive statistics for both groups at each measurement time as well as the results of the univariate analyses and their effect sizes.
Table 1. Means, standard deviations, F value, significance and effect sizes for expectation of success and the positive components of subjective tasks value
Results from the multivariate analysis for cost and pressure were non-significant for the “Group” factor (F(2, 230) = 1.616, p = .20) and for the interaction between both “Group X Time” factors (F(4, 460) = 1.211, p = .31), but were significant for the “Time” factor (F [4, 460] = 2.767, p < .05). Table 2 displays descriptive statistics for both groups at each measurement time along with results from the univariate analyses and their effect sizes. These results indicate that it was students’ experience of pressure that increased over time (F = 3.096, p < .05), but the effect size was small (ηp2 = .03).
Table 2. Means, standard deviations, F value, significance and effect sizes for the negative components of subjective tasks value
Discussion
The objective of the present study was to evaluate if unmotivated students’ participation in an event organized by four PE teachers allowed them to increase their expectations of success and subjective task values toward PE while reducing cost in time, energy and opportunities as well as the feeling of pressure in PE classes.
Results revealed that, although PE teachers identified the participants as less motivated toward PE, this perceived lack of motivation was not reflected in the students’ answers. This is consistent with teachers’ tendency to over-identify special education children and the fact this evaluation sometimes depends on the composition of the group or school (Banks, Shevlin, & McCoy, 2012). It is hardly surprising, therefore, that the proportion of students identified as having special educational needs varies significantly from one teacher to another (Van der Veen, Smeets, & Derriks, 2010; Smeets & Roeleveld, 2016). In fact, it appears that identifying children’s vulnerabilities and special needs is a complex task for elementary school teachers (Isaksson, Lindqvist, & Bergström, 2010). Accordingly, future research should concentrate on encouraging teachers to validate their perceptions from multiple perspectives and using different methods. For example, teachers would certainly benefit from working closely with the elementary school teacher responsible for the same group of students in order to compare their evaluation of these students’ vulnerabilities.
Moreover, the fact that students’ self-reported motivation was somewhat positive raises many questions. First, considering the young age of the participants and despite our instructions on the importance of answering as honestly as possible, the children may have felt obliged to give “correct” answers to the questions, as is their custom for school work. Second, the high scores may be the result of their first-time participation in a “special” project involving PE. In other words, the fact their PE teachers said they had been “selected” for the project may have positively altered their perception, creating a sense of reward. Therefore, when the children were asked about their valuation of PE, their responses suddenly tended toward the positive, even though the initiative had not yet been implemented. Finally, teachers’ perception of students’ motivation may plausibly differ from that of their students. Children of this age often see PE as fun and entertaining, even if they appear unmotivated to learn from their teachers’ point of view.
In line with these hypotheses, and in view of the high scores reported by the students even prior to the initiative, the absence of a significant increase in students’ expectation of success and subjective task values (attainment, utility value and interest) is not surprising. According to these results, if teachers decide to repeat this type of project, we would recommend starting it earlier in the school year and implementing it more often throughout the year. However, the stability of the motivational variables over the school year is encouraging in itself because we usually observe a decrease in these variables at this age (Wigfield et al., 1997; Xiang, McBride, Guan, & Solmon, 2003; Xiang, McBride, & Bruene, 2006; Xiang, McBride, & Guan, 2004). Finally, the increase in pressure during the school year was not expected. A possible explanation is that the third wave of measurement occurred during the last semester of the school year, close to the final assessment, when students may be feeling more stressed. This result supports the importance to consider cost variables in the physical activity domain to have a more comprehensive understanding of students’ motivational processes (Stuart, 2003; Wigfield et al., 2009). In fact, even if PE teachers took the initiative to introduce new physical activities (Doolittle, 2016; Tenoschok, 2016) and to highlight their usefulness (Wigfield, Eccles, Schiefele, Roeser, & Davis-Kean, 2006) during a positive event taking place in a secure environment (Pharez, 2016), it did not prevent students from feeling pressure and tension at the end of the school year. This suggests that additional strategies need to be implemented to reduce thess kind of feelings. As Gagnon (2016, p. 25) stated: “Students who feel safe to try, who are supported in their failures, and who are encouraged to keep trying will learn better.”
Limitations and Conclusion
This research project was grafted onto a project already in place, which accounts for many of its limitations. First, the method teachers had already chosen to identify “vulnerable” students was not empirically validated and was only based on their subjective observations. Second, at the start of the project, teachers wanted all children to take part in the initiative and were reluctant to create a control group. To compromise, we agreed to create uneven groups with a larger number of children in the experimental group. Third, the initiative was intended to take place in December but, owing to the schools’ constraints, was not implemented until February. Another limitation is that students’ responses did not reflect teachers’ perceptions regarding their level of motivation. Although the questionnaires were carefully chosen, certain items may have been too complex for children this age. Moreover, considering the number of students selected per school, it is possible that their level of vulnerabilities varied, which might explain the results obtained with the present sample. In future research, students could be questioned based on a qualitative approach that helps identify the underlying reasons for their perceptions. Doing so, we could concentrate on a smaller number of students identified as being highly vulnerable in PE.
In conclusion, although the initiative did not produce the anticipated results, both teachers and students appreciated the experience. This was a success in itself because it highlighted the importance of collaboration by scholars and practitioners. Finally, we believe in the importance of ongoing encouragement and support for initiatives aimed at promoting students’ motivation toward PE and physical activity.
--
1.Free translation by the authors.
2.Poull-ball is a collective sport: two teams of five people compete with a big ball on a rectangular field and their goal is to drop one of the two targets. For more information, see http://www.poull- ball.com/en/index.html
3.Teachers requested a higher number of students in the experimental group as a condition for participation in the research project.
4.The number of participants in the two groups differed for two reasons: 1) more students were assigned to the experimental group at the start, and 2) more students from the control group did not obtain their parents' consent.
5.The deprivation index of the participating schools varied from 7 to 10, where 1 indicates the least disadvantaged and 10 the most disadvantaged.
References
Banks, J., Shevlin, M., & McCoy, S. (2012). Disproportionality in Special Education: Identifying Children with Emotional Behavioural Difficulties in Irish Primary Schools. European Journal of Special Needs Education, 27, 219–235.
Bruggink, M., Goei, S. L., & Koot, H. M. (2013). Characteristics of teacher-identified students with special educational needs in dutch mainstream primary education. Educational Research, 55, 361-375.
Chen, S., Chen, A., & Zhu, X. (2012). Are K–12 Learners motivated in physical education? a meta-analysis. Research Quarterly for Exercise and Sport, 83(1), 36-48. doi: 10.1080/02701367.2012.10599823
Comité scientifique de Kino-Québec. (2011). Physical activity, sport and young people –Know and act. Recreation and Sport Secretariat, Ministry of Education, Recreation and Sports, gouvernement du Québec. Retrieved from http://www.kinoquebec.qc.ca/publications/ActivitePhysique_LeSportEtLesJeunes_AvisKQ.pdf
Cox, A. E., & Whaley, D. E. (2004). The influence of task value, expectancies for success, and identity on athletes' achievement behaviors. Journal of Applied Sport Psychology, 16(2), 103-117. doi: 10.1080/10413200490437930
Dempsey, J. L., Kimiecik, J. C., & Horn, T. S. (1993). Parental influence on children's moderate to vigorous physical activity participation: An expectancy-value approach. Pediatric Exercise Science, 5, 151-167.
Doolittle, S. (2016). Engaging middle school students in physical education and physical activity programs. Journal of Physical Education, Recreation & Dance, 87(6), 29-34. doi: 10.1080/07303084.2016.1192940
Eccles, J. S. (2005). Subjective task values and the Eccles et al. model of achievement related choices. In A. J. Elliot, & C. S. Dweck (Eds.), Handbook of Competence and
Motivation (pp. 105-121). New York, NY: Guilford Press. Eccles, J. S., Adler, T. F., Futterman, R., Goff, S. B., Kaczala, C. M., Meece, J. L., &
Midgley, C. (1983). Expectancies, values, and academic behaviors. In J. T. Spence (Ed.), Achievement and achievement motivation (pp. 75-146). San Francisco: W. H. Freeman.
Eccles, J. S., O'Neill, S. A., & Wigfield, A. (2005). Ability self-perceptions and subjective task values in adolescents and children. In K. Anderson Moore, & L. H.
Lippman (Eds.), What do Children Need to Flourish? New York, NY: Springer. Eccles, J. S., & Wigfield, A. (1995). In the mind of the actor: The structure of adolescents' achievement task values and expectancy-related beliefs. Personality and Social Psychology, 21(3), 226-236.
Eccles, J. S., & Wigfield, A. (2002). Motivational beliefs, values, and goals. Annual Review of Psychology, 53, 109-132.
Gagnon, A. G. (2016). Creating a positive social-emotional climate in your elementary physical education program. Strategies, 29(3), 21-27. doi:10.1080/08924562.2016.1159153
Gao, Z., Lee, A. M., Solmon, M. A., & Zhang, T. (2009). Changes in middle school students’ motivation toward physical education over one school year. Journal of Teaching in Physical Education & Sport Pedagogy, 28, 378-399.
Hair, J. F., Black, W. C., Babin, B. J., Anderson, R. E., & Tatham, R. L. (2006). Multivariate data analysis (6th ed.). New Jersey: Prentice Hall Pearson Education.
Hedhili, A. (2016). Multidimensional analysis of persistence in undergraduate university studies. (Unpublished doctoral dissertation). Université Laval, Québec (Canada).
McAuley, E., Duncan, T., & Tammen, V. V. (1989). Psychometric properties of the intrinsic motivation inventory in a competitive sport setting: A confirmatory factor analysis. Research Quarterly for Exercise and Sport, 60(1), 48-58.
Ministère de l’Éducation, du Loisir et du Sport. (2009).Students with disabilities or learning difficulties: Evolution of enrollments and school progress at public school. Gouvernement du Québec. Retrieved from http://education.gouv.qc.ca/fileadmin/site_web/documents/PSG/recherche_evaluation/AaMemeEcoleEHDAA_f.pdf
Pallant, J. (2016). SPSS survival manual: A step by step guide to data analysis using IBM SPSS (6th ed.). England: McGraw-Hill Education. ParticipACTION. (2018). The brain + body equation. The 2018 ParticipACTION report card on physical activity for children & youth.. Toronto, Canada: ParticipACTION.
Pharez, E. S. (2016). Enjoyment fosters engagement: The key to involving middle school students in physical education and physical activity. Journal of Physical Education, Recreation & Dance, 87(6), 24-28. doi: 10.1080/07303084.2016.1192939
Raedeke, T. D. (1997). Is athlete burnout more than just stress? A sport commitment perspective. Journal of Sport and Exercise Psychology, 19, 396-417. Smeets, E., & Roeleveld, J. (2016). The identification by teachers of special educational needs in primary school pupils and factors associated with referral to special education. European Journal of Special Needs Education, 1-17. doi: 10.1080/08856257.2016.1187879
Stuart, M. (2003). Sources of subjective task value in sport: An examination of adolescents with high or low value for sport. Journal of Applied Sport Psychology, 15(3), 239-255. doi: 10.1080/10413200305388
Tenoschok, M. (2016). A true middle school physical education program. Journal of Physical Education, Recreation & Dance, 87(6), 9-15. doi: 10.1080/07303084.2016.1192935
Wigfield, A. (1994). Expectancy-value theory of achievement motivation: A developmental perspective. Educational Psychologist, 6(1).
Wigfield, A., & Eccles, J. S. (1992). The development of achievement task values: A theoretical analysis. Developmental review, 12(3), 265-310.
Wigfield, A., Eccles, J. S., Schiefele, U., Roeser, R. W., & Davis-Kean, P. (2006). Development of achievement motivation. In N. Eisenberg (Ed.), Handbook of child psychology: Social, emotional, and personality development (6th ed., Vol. 3, pp. 933 1002). New York, NY: Wiley.
Wigfield, A., Eccles, J. S., Suk Yoon, K., Harold, R., Arbreton, A., Freedman-Doan, C., & Blumenfeld, P. C. (1997). Change in children's competence beliefs and subjective task values across the elementary school years: A 3-year study. Journal of Educational Psychology, 89(3), 451-469.
Wigfield, A., Tonks, S., & Klauda, S. L. (2009). Expectancy-Value Theory. In K. R. Wentzel, & A. Wigfield (Eds.), Handbook of Motivation at School (pp. 55-75). NewYork, NY: Routledge.
Xiang, P., McBride, R., Guan, J., & Solmon, M. (2003). Children's motivation in elementary physical education: An expectancy-value model of achievement choice. Research Quaterly of Exercise and Sport, 74(1), 25-35. doi: 10.1080/02701367.2003.10609061
Xiang, P., McBride, R. E., & Bruene, A. (2004). Fourth graders' motivation in an elementary physical education running program. The Elementary School Journal, 104(3), 253-266.
Xiang, P., McBride, R. E., & Bruene, A. (2006). Fourth-grade students' motivational changes in an elementary physical education running program. Research Quaterly of Exercise and Sport, 77(2), 195-207. doi: 10.1080/02701367.2006.1059935


